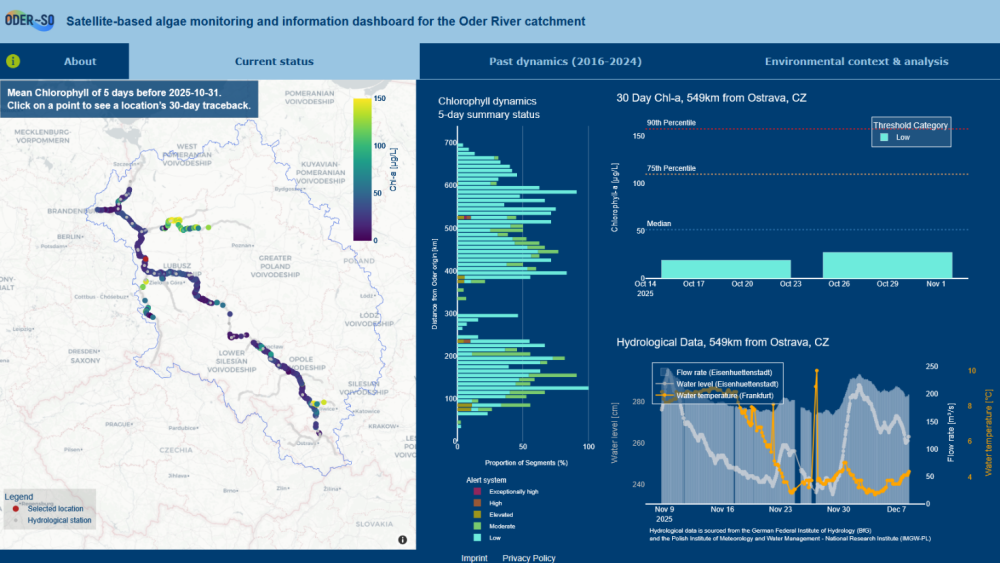
The ODER~SO dashboard visualizes the spread of algal blooms based on satellite data. (Screenshot from oderso-dash.igb-berlin.de)
Researchers Paula Torre Zaffaroni and Tobias Goldhammer from the ODER~SO project developed and implemented the ODER~SO Dashboard in collaboration with Brockmann Consult, an environmental data analysis and software company based in Hamburg. The satellite data collected is fed into the platform and visualized in graphs.
How it works
The satellite-based monitoring is based on Sentinel-2 data. Sentinel-2 are two satellites of the European Union Space Programme that orbit the earth and capture images of the entire land area of the world within five days. “We use these images to obtain two measurements: the concentrations of the green plant pigment chlorophyll and the turbidity of the water in the Oder River,” explains Paula Torre Zaffaroni. The two values allow conclusions to be drawn about the algae density in the river, but not about the type of algae. Whether it is the algae Prymnesium parvum, which killed around 1,000 tons of fish with its toxin in the summer of 2022, can currently only be determined by a molecular biological laboratory test.
Paula Torre Zaffaroni and Tobias Goldhammer also evaluated the satellite data retrospectively for the period from 2016 to 2024, enabling them to trace the development of algal blooms in the Oder. Using the satellite data, they were able to detect the algal bloom in the summer of 2022 around four weeks before the fish kill occurred in the upper reaches of the German Oder.
Platform improves early detection of algal blooms
“The platform provides us with a tool that allows us to observe changes throughout the entire Oder river basin,” says Tobias Goldhammer. “It allows us to locate the development of algal blooms in the Oder and larger tributaries and monitor their spread.” He therefore recommends that environmental authorities in Germany consider incorporating satellite-based algae monitoring of the Oder into official water monitoring. It could improve the data basis and response time for the official warning system.
The evaluation of satellite data will continue in near real time until at least the end of April 2026—the data will be available every five days after the satellite passes overhead and will be available on the platform within a further 24 hours. In order for the satellite data to be usable, the position of the sun and weather conditions must allow for the capture of clear images.
The ODER~SO Dashboard also incorporates data on water temperature and flow velocity, among other things. In addition, the tool takes into account data from water monitoring by the Brandenburg State Office for the Environment and the Polish Environmental Inspectorate GIOŚ.
Paula Torre Zaffaroni explains how data collection works and what conclusions researchers can draw from the data obtained in this video.
~~
Publication:
Stelzer K., Torre Zaffaroni P., Scholze J., Bremerich V., Lebreton C., Goldhammer T. (2025) Einsatz von Satellitendaten zur Erfassung der Wasserqualität in großen Flusssystemen am Beispiel der Oder. In: Deutsche Gesellschaft für Limnologie (DGL) Ergebnisse der Jahrestagung 2024 (Dresden), Essen, 2025